 ARMF
ARMFTradingView: the long position tool and the risk calculation
The long position tool in TradingView is the platform's most underrated element: it turns the markup of a chart into the three numbers you need before the order — the price of being wrong, the ratio of risk to result and the volume for a set percentage of the account. We look at how it is set up, why its readings differ from the broker's terminal and which risk management tasks stay outside the chart.
TradingView is a chart and planning, not a place of execution. The trade is marked up here: the entry level, the level that cancels the idea, the target. The order goes to the broker — directly through a connection or by hand in the terminal.
What the position tool shows
The drawing panel has two mirrored tools — one for buying and one for selling. Both are built with three drags: the entry level, the stop level, the target level. After that the platform counts on its own.
| The number on the chart | How it is obtained | What to do with it |
|---|---|---|
| Distance to the stop | the difference between the entry price and the stop | the starting value for the volume |
| Risk as a percentage of the price | the distance ÷ the entry price | comparing trades on different pairs |
| The distance to the target | the difference between the target price and the entry | a check that the idea is realistic |
| The ratio of risk to result | the target ÷ the stop | a filter for entries before the order |
| Money risk | the risk percentage × the size of the account | the price of being wrong in the account currency |
| Quantity | the risk ÷ (the stop × the tick value) | the volume you have to enter at the broker |
The last two rows appear only after it is set up: by default the tool shows the percentages and the ratio but does not know your account.
How to set up the TradingView position calculator
The setup is done once and saved in the tool's template. After that every new markup immediately shows the volume for your risk percentage — effectively a built-in TradingView position calculator, only tied to the chart rather than to a separate form.
A double click on the drawn position opens the parameters: the size of the account, the currency, the risk and the lot size.
onceEquity, not the balance, and in the account currency. The number is updated by hand — the platform does not know the state of your deposit.
once a weekA percentage of the account or a fixed amount. A percentage is more convenient: the volume will be recalculated automatically when the deposit changes.
onceFor currency pairs it is a hundred thousand units of the base currency per standard lot. Without that field the quantity is counted in units rather than in lots.
onceOtherwise the settings will have to be repeated for every new markup, and sooner or later one trade will be counted with someone else's parameters.
compulsoryquantity = (the size of the account × the risk) ÷ (the distance to the stop × the tick value)
Risk reward ratio in TradingView: how to read the ratio
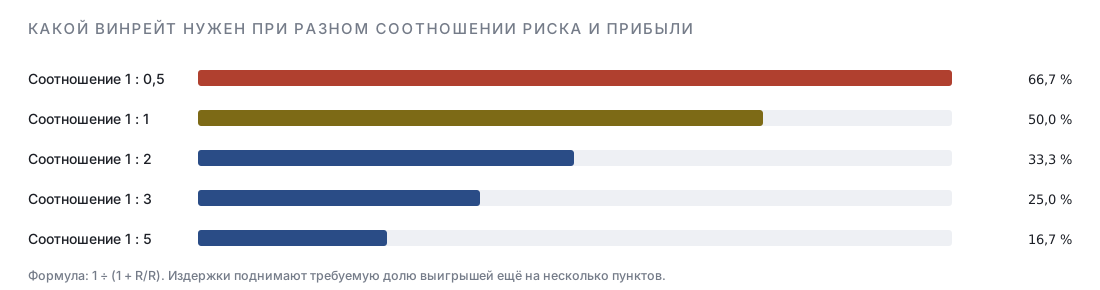
TradingView shows the risk reward ratio right on the chart, and that changes the selection of trades: it becomes visible that the target is drawn too far away or the stop is set too close, before the order is even sent. A high ratio on its own guarantees nothing — it works in a pair with the share of winners.
| Ratio | Break-even win rate | Win rate 40 % | Win rate 50 % |
|---|---|---|---|
| 1 : 1 | 50.0 % | a loss of −0.20 R | zero |
| 1 : 1.5 | 40.0 % | zero | plus 0.25 R |
| 1 : 2 | 33.3 % | plus 0.20 R | plus 0.50 R |
| 1 : 3 | 25.0 % | plus 0.60 R | plus 1.00 R |
| 1 : 5 | 16.7 % | plus 1.40 R | plus 2.00 R |
The table explains why the drawn ratio is worth comparing with your own statistics: a target of five risks is reached noticeably more rarely than a target of one, and the gain in the expectancy column is partly eaten by the fall in the win rate.
Why the numbers differ from the broker's terminal
The markup on the chart and the order at the broker live in different systems, and that is fine as long as the difference is understood. Four sources of discrepancy come up all the time.
Alerts and bar replay
Two functions of the platform relate directly to risk management, although they do not look like calculators.
TradingView and risk: short answers
- Can risk per trade be counted in TradingView
- Yes, if the size of the account and the risk percentage are set in the position tool's settings. Then the platform will show the permissible quantity itself.
- Is the size of the account updated automatically
- No. The value is entered by hand, so it is worth revising after a noticeable change in the deposit — otherwise the volume is counted from an outdated number.
- Does the platform count margin
- No. Leverage and the required collateral stay in the broker's terminal: the chart does not know the terms of your account.
- Do you need a paid subscription for risk management
- The position tool and the alerts work on the free plan too. A subscription lifts the limits on the number of alerts and the depth of history.
- Does the tool account for the spread and the commission
- No, the markup is built on the chart's price. Costs are added separately — it is exactly they that turn a ratio of 1 : 2 into 1 : 1.7.
- Does bar replay replace a simulator
- No: it has no spread, no swap and no model of execution. It is useful for checking the markup, not for assessing the statistics of a system.
Frequently asked questions
Where is the long position tool in TradingView
On the vertical drawing panel on the left, in the group of forecasting and measuring tools. The mirrored short position tool for sell trades sits there too.
How do I make the tool show the volume in lots
In the settings you have to fill in the size of the account, the risk percentage and the lot size. For currency pairs the lot size equals a hundred thousand units of the base currency, after which the quantity is displayed in the usual lots.
Why does the ratio of risk to reward change when I drag the stop
The ratio is the relation between the distance to the target and the distance to the stop. By moving the stop closer you reduce the denominator and the picture improves, although the chance of the stop being taken out by noise grows at the same time.
Can you trade straight from TradingView
Some brokers offer a connection, and the order goes from the chart. The margin calculation and the actual execution still happen on the broker's side.
Does the TradingView chart match the broker's quotes
Not always: the data sources are different. For markup that does not matter, for an exact stop level it does, especially on short distances.
How can alerts be used to control risk
Put a notification on the entry level instead of waiting at the screen, and one on the level that cancels the idea to control execution. Less time at the chart means fewer trades that were not in the plan.
Is there any point in Pine Script for managing risk
There is: a Pine strategy counts the volume from a percentage of capital and includes the commission and slippage in the report. But the tester's result is a model, not a promise of a future result.
What do I do if the quantity comes out below the broker's minimum volume
It means the trade does not fit the risk: either the stop is too long for your deposit or the risk percentage is set too small. The right way out is to skip the trade, not to increase the risk.
Does the tool show the probability of reaching the target
No, and no tool shows it. The ratio is the geometry of levels; the probability comes only from your own statistics over the distance.
Can a different risk be set for different pairs
Several templates of the tool with different parameters can be saved. But it is usually more useful to keep one percentage for all pairs and change the distance to the stop rather than the share of risk.
Does the platform account for the correlation of open positions
No. The total risk across several correlated pairs is counted separately — on the chart every trade looks independent.
Do you need TradingView if you have the broker's terminal
Not necessarily, but markup and planning are more convenient in it, and the position tool shows the ratio and the volume at the same time. Execution still stays in the terminal.
Read next
