 ARMF
ARMFDrawdown in trading
Drawdown in trading is the decline of equity from the maximum reached. It is the main risk characteristic of a trading system: the return over distance changes, while the depth of drawdowns stays fairly stable. We take apart the calculation base, the types of drawdown and which depth counts as the limit.
What drawdown is and how it is calculated
The formula: drawdown = (peak equity − current equity) ÷ peak equity × 100 %. The key word is «peak»: the base is taken from the maximum the account reached, not from the starting deposit.
The difference is fundamental. An account grew from $10,000 to $14,000 and then fell to $11,200. Relative to the deposit it is 12 % in profit, but the drawdown is 20 % — and it is that figure that describes the risk of the system. Profit that was received and given back is just as much a loss as one from the starting amount.
| Indicator | What it measures | Formula |
|---|---|---|
| Current drawdown | How far below its peak the account is right now | (peak − equity) ÷ peak |
| Maximum drawdown | The deepest decline over the period | the maximum of all current drawdowns |
| Drawdown by balance | The decline on closed trades | does not include open positions |
| Drawdown by equity | The decline including the floating result | the main value for assessing risk |
| Duration of a drawdown | How long the account stays below the peak | from the date of the peak to the date of the return |
Drawdown by balance always looks smaller than by equity: while a loss is floating it does not enter the balance. That is exactly why statistics are better kept by equity — otherwise a system with long «sit-outs» will look calmer than it is.
Why the duration matters more than the depth
A drawdown of 15 % the account climbed out of in two weeks and a drawdown of 15 % that lasts seven months feel completely different, although the figure is the same. The second situation is the main reason traders abandon working systems: over that time enough doubt accumulates to start changing the rules.
What the duration of a drawdown tells you
- Short and deep
- Usually the result of a losing streak in a row. It is expected and predictable from the win rate: the length of the streak is calculated in advance.
- Long and shallow
- The system has stopped finding profitable trades but is not losing sharply either. Often it means a change of market regime — for example a move from a trend into a range.
- Long and deep
- A signal to stop and check the system on history. Trading on without a review here amounts to testing a hypothesis with money.
Maximum drawdown: which depth counts as the limit
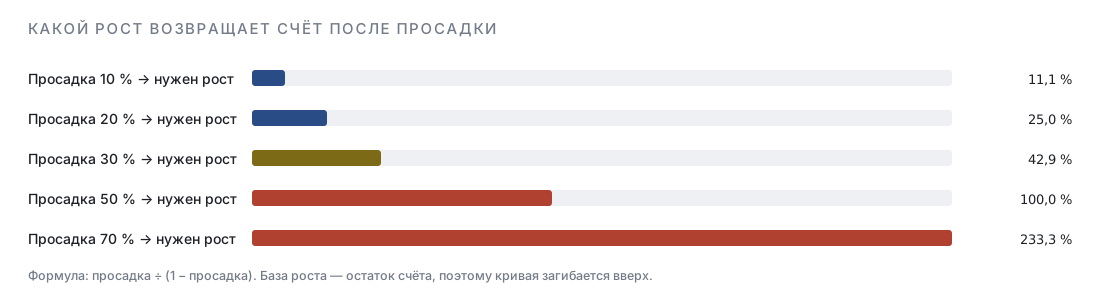
There is no universal threshold, but there is the arithmetic of recovery, which makes the 10–20 % range a natural boundary for a retail account.
| Drawdown | Growth needed to recover | Trades at an expectancy of +0.35 % per trade | The practical meaning |
|---|---|---|---|
| 10 % | +11.1 % | 30 | The working mode of the system |
| 20 % | +25.0 % | 64 | The threshold for a review: a streak or a change of regime? |
| 30 % | +42.9 % | 102 | The system is taken out of service |
| 50 % | +100.0 % | 199 | The recovery is comparable with a new deposit |
The number of trades is calculated for a system with a win rate of 45 %, a ratio of 1 : 2 and 1 % risk: the average equity gain per trade is 0.35 %. The values are model ones and given for comparing orders of magnitude rather than as a forecast.
How to measure the drawdown on your own forex account
The terminal shows the current result but not the depth of the drawdown: for that you need a series of equity values tied to time. The calculation procedure is simple and takes ten minutes in any spreadsheet.
With closing dates and the result in money. The terminal report will do: only the time and the amount are needed.
from the reportA running sum of the results starting from the deposit. That is the equity curve on closed trades.
one columnIn the next column, the maximum of the curve up to and including this row. It only grows and never falls.
a second column(maximum − equity) ÷ maximum in every row. The largest value in the column is the maximum drawdown of the period.
a third columnCounting only closed trades understates the hole: floating losses do not enter it. For the full picture you need a series of equity values tied to time rather than to trades — not every terminal exports it, but it can be approximated by recording the maximum move against the position in the journal.
Frequently asked questions
What is drawdown in simple words?
It is how far the account has fallen from its best point. If the deposit grew to $12,000 and then fell to $10,800, the drawdown is 10 % — regardless of the amount you started with.
How does maximum drawdown differ from current drawdown?
The current one shows the state right now, the maximum the worst moment over the whole period. For assessing the risk of a system it is the maximum that matters: it answers the question «what was the hardest» and serves as a reference for the future.
Which drawdown is normal for a trading system?
It is set by your limit per trade and your share of winners rather than by the market. At a 1 % limit and a share of around 45 %, drawdowns of 5–12 % are ordinary; going beyond 20 % means either an unusually long streak or a change in the conditions the system worked in.
Should drawdown be counted by balance or by equity?
By equity. A calculation by balance hides floating losses: a system that holds losing positions for a long time looks stable by balance right up to the moment they are closed.
How does leverage affect the depth of a drawdown?
Directly, not at all: the drawdown is set by the risk per trade and the length of the losing streak. Indirectly, noticeably: wide leverage allows a lot at which the bet per trade turns out to be not 1 % but 5–10 %, and the same chain gives a drawdown several times deeper.
Should the swap be included in the drawdown?
Yes, it reduces equity regardless of the price move. On swing positions a negative swap over a month is visible in the account curve, and excluding it from the calculation makes the picture more optimistic than reality.
What counts as a normal drawdown for a forex account?
A value matching your risk and win rate rather than an industry standard. At a 1 % bet and a share of winners around 45 % the expected chain of eight losses gives about 7.7 % — drawdowns in that range are normal, going beyond 20 % calls for a review.
Is a 30 % drawdown already a reason to abandon a system?
It is a reason to stop and check it on history rather than a verdict. The key question is whether the current drawdown is deeper than anything encountered over the test period. If it is, the conditions changed or the rules were broken; if not, this is an expected event.
How does drawdown differ from the loss on a single trade?
A trade loss is a one-off event limited by your risk. A drawdown is the accumulated decline of equity from the maximum, and it is made up of a series of losses, costs and swaps. It is the drawdown that describes the risk of a system, not the size of an individual stop.
How do you tell a system drawdown from your own mistakes?
By the «to plan / off plan» mark in the journal. Calculate the drawdown separately on the trades that followed the rules: if it fits the norm, the issue is not the system but the execution.
Read next
