 ARMF
ARMFRisk-to-reward ratio
The risk-to-reward ratio shows how many times further the target is than the stop. On its own it decides nothing: a system with 1 : 1 can be more profitable than one with 1 : 3. What decides is the product of the ratio and the win rate. We take apart the calculation, the break-even win rate and the common misconception about «at least 1 : 3».
Risk reward ratio: how the ratio is calculated
R/R = (target − entry) ÷ (entry − stop)
For a buy: entry at 1.0850, stop at 1.0810, target at 1.0930. The risk is 40 pips, the potential profit 80 pips, the ratio 1 : 2. It is usually written as «one to two», where the two is the size of the target in units of risk.
The reverse notation also occurs — the ratio of risk to reward, giving 0.5 for the same trade. Both forms are correct; what matters is not to mix them up: in one more is better, in the other the opposite.
What must be included in the calculation
- The spread is part of the risk
- A position is opened on one side of the spread while the stop is executed on the other. On a 20-pip stop a spread of 1.5 pips worsens the ratio from 1 : 2.00 to 1 : 1.79.
- The target has to be reachable
- The ratio is easy to improve by moving the target away — but the share of targets reached falls with it. That is moving the problem rather than solving it.
- Count by the close, not by the intention
- The journal records the actual ratio of closed trades: partial closes and trailing exits change it relative to what was intended.
The risk-to-reward ratio on forex and the break-even win rate
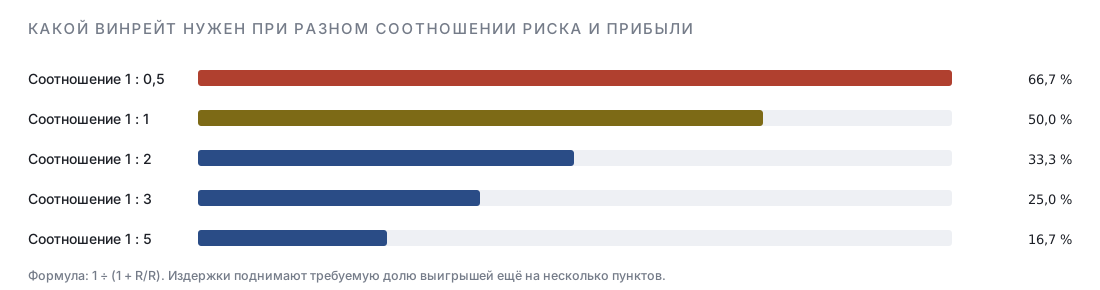
The main practical use of the ratio is computing the share of winners at which a system breaks even.
break-even win rate = 1 ÷ (1 + R/R)
| Ratio | Break-even win rate | Expectancy at a win rate of 40 % | Expectancy at a win rate of 55 % |
|---|---|---|---|
| 1 to 0.5 | 66.7 % | −0.40 R | −0.17 R |
| 1 to 1 | 50.0 % | −0.20 R | +0.10 R |
| 1 to 1.5 | 40.0 % | 0.00 R | +0.38 R |
| 1 to 2 | 33.3 % | +0.20 R | +0.65 R |
| 1 to 3 | 25.0 % | +0.60 R | +1.20 R |
| 1 to 5 | 16.7 % | +1.40 R | +2.30 R |
The table reads like this: at a ratio of 1 : 2 winning a third of the trades is enough not to lose. But the inverse relationship exists too and is usually underestimated: the further the target, the less often it is reached, so a move from 1 : 2 to 1 : 5 is almost always accompanied by a falling win rate — and the expectancy may well not grow.
Why the «at least 1 : 3» rule is misleading
The requirement to take only trades with a ratio no worse than 1 : 3 sounds sensible and often helps a beginner — it filters out entries with a cramped target. But as a universal rule it is wrong, and here is why.
The correct wording of the rule: a trade is taken if the expectancy is positive including costs. A ratio of 1 : 3 is a special case, convenient when the win rate is unknown.
Planned and actual ratio: why they diverge
In the plan a trade looks like 1 : 3, in the journal the average turns out to be 1 : 1.4. The discrepancy is explained by four causes, and each of them is measurable.
| Cause | What happens | How to detect it |
|---|---|---|
| An early exit from winning trades | The target was not reached, the position was closed «just in case» | Compare the actual result with the maximum price move |
| A partial close | Half the position was closed at 1R, the average result is below the planned target | Count the result of a trade as a weighted average rather than by the last part |
| Moving the stop to break-even | Part of the trades end at zero instead of at the target | A separate «at break-even» category in the journal |
| Costs | The spread and the commission reduce the profit and increase the loss | Recalculate the ratio from the actual fill prices |
The practical conclusion: planning has to be done from the actual ratio rather than from the intended one. A system with a planned 1 : 3 and an actual 1 : 1.4 requires a win rate not of 25 % but of 42 % — and that is a completely different requirement for the precision of entries.
Frequently asked questions
Which risk-to-reward ratio counts as good?
The one at which the expectancy of the system is positive including costs. For a win rate around 40 % that is a ratio from 1 : 1.5; for a win rate of 60 % 1 : 1 is enough. There is no universal «good» value — there is one consistent with the win rate.
How do you count the ratio with a partial close?
By the actual result: if half the position closed at 1R and the second half at 3R, the result of the trade is 2R. It is that value that has to go into the journal, otherwise the averages will be inflated.
Can the ratio be improved by shortening the stop?
Formally yes, but the probability of the stop triggering grows with it: a shortened stop more often ends up inside market noise. The ratio improves, the win rate falls, and the expectancy may even get worse.
What is R and why is the result counted in it?
R is the risk amount at entry. A result in these units depends neither on the account nor on the risk share, which makes it a convenient way to keep statistics: «+14R for the month» reads the same on any deposit.
What is the correct name for this metric?
Two variants occur in Russian-language practice: «the ratio of risk and reward in trading» and the English risk reward ratio. It is one and the same value — the ratio of the distance to the target to the distance to the stop.
How do you calculate R/R from prices on EUR/USD?
Subtract the levels: with an entry at 1.0850, a stop at 1.0810 and a target at 1.0930 the risk is 40 pips, the potential 80, the ratio 1 : 2. Counting in pips is more convenient than in fractions of the price: the numbers come out whole.
Which ratio is realistically achievable intraday?
More often 1 : 1.5…1 : 2. More distant targets are reached less often intraday, because the daily range is limited: a 5R target on a pair with an ATR of 80 pips requires a move that does not happen every day.
How do costs change the ratio?
They increase the risk and reduce the potential. A spread and commission of 10 % of the risk turn 1 : 2 into 1 : 1.73 and raise the required win rate from 33.3 to 36.7 %. On tight stops the effect is stronger.
Should the ratio be counted from the planned levels or from the fact?
From the fact of the close — it is those numbers that describe the system. The planned ratio is useful as an entry filter, but what goes into the statistics has to be what actually happened.
How is the ratio linked to the choice of timeframe?
On lower timeframes the stops are shorter and the costs as a share of risk higher, so the net ratio is worse than planned. On higher ones it is the other way round: the spread barely matters, but the targets are reached less often and take longer.
Can the ratio be too large?
It can — if the target stops being reachable. A ratio of 1 : 10 at a win rate of 5 % gives negative expectancy, although on paper it looks attractive. What has to be looked at is the product of the win rate and the ratio.
Read next
