 ARMF
ARMFThe probability of a losing streak over distance
It is more useful to calculate the probability of a losing streak than to hope it will not happen: chains of stops are the working mode of any system rather than a breakdown, because the outcome of a single trade is random. The calculation shows how likely a streak of a given length is over your stretch, what maximum to expect and what share of runs reaches the boundary at which you stop trading.
The streak and risk of ruin calculation
The probability of a streak is calculated exactly, with a Markov chain. The share of runs that reached the boundary and the median drawdown come from a simulation of 3,000 runs with a fixed seed: with the same inputs the answer is always identical.
How the probability of a streak is calculated
The two parts of the calculation use different methods, and that is a deliberate decision.
- The probability of a streak — an exact formula
- Calculated with a Markov chain: the state is the current length of the losing streak, and the absorbing state is reaching the given length. The method gives an exact answer rather than an estimate.
- The expected maximum of a streak — an approximation
- An estimate by the formula ln(N × p) ÷ ln(1 ÷ q), where N is the number of trades, p is the win rate and q is the share of losses. It gives the order of magnitude: the exact formula for the distribution of the maximum is more complex and not needed in practice.
- Drawdown and risk of ruin — a simulation
- 3,000 runs of N trades with the risk recalculated from current equity. The generator seed is fixed, so with the same inputs the answer is reproducible.
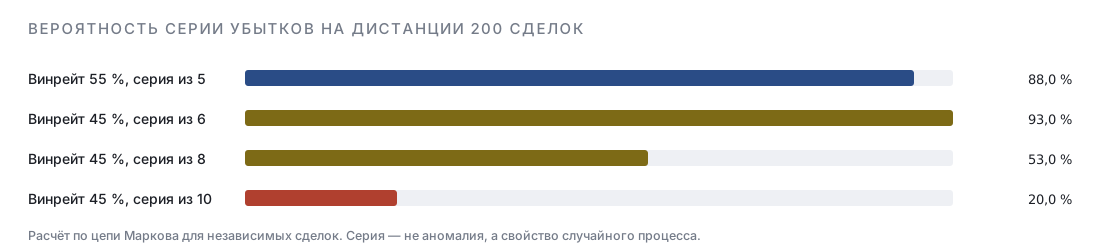
The bars on the chart are the probabilities of streaks from two to nine trades long over your distance. The length chosen with the slider is highlighted in colour.
What to do with these numbers
The main use of the calculation is choosing the risk percentage. The order is this: look at the expected maximum of the streak, add a buffer to it and check what drawdown such a streak gives at the chosen risk.
| Win rate | Expected maximum over 200 trades | Drawdown at 1 % risk | at 2 % risk | at 5 % risk |
|---|---|---|---|---|
| 55 % | about 6 | −5.9 % | −11.4 % | −26.5 % |
| 50 % | about 7 | −6.8 % | −13.2 % | −30.2 % |
| 45 % | about 8 | −7.7 % | −14.9 % | −33.7 % |
| 40 % | about 9 | −8.6 % | −16.6 % | −37.0 % |
| 35 % | about 10 | −9.6 % | −18.3 % | −40.1 % |
The column with 5 % risk shows why that figure does not suit most systems: one expected streak — and it is expected, not extreme — takes away between a quarter and forty percent of the account.
An important caveat about independence. The calculation assumes the outcomes of trades are not linked. In real trading this is not quite so: market regimes replace one another and losses cluster. The practical conclusion is to treat the expected maximum of a streak as a lower estimate rather than an upper one.
How to apply the result to trading currency pairs
The four numbers in the widget answer different questions, and mixing them up is a bad idea.
- Probability of the streak
- An exact answer to the question «will I meet such a streak». A value above 80 % means the streak is practically inevitable and has to be built into the plan.
- Expected maximum
- An estimate of the longest streak over the distance. That is the number you add two or three stops of buffer to when choosing the risk percentage.
- Share of runs to the boundary
- The chance that the account reaches your stopping boundary. Even with positive expectancy it is not zero.
- Median drawdown
- Half of the runs pass through a deeper drawdown. Planning should be done from the upper part of the distribution, not from the middle.
Related calculations. The drawdown depth you found is converted into a recovery time by the drawdown calculator, the upper bound of a sensible bet is shown by the Kelly share calculation, and the size for the chosen percentage is worked out by the lot calculator.
Frequently asked questions
Is this the same as a risk of ruin calculator?
Close: English-language calculators with that name work out the probability of reaching a given boundary. Here that value comes from a simulation and is complemented by the probability of a streak of a given length — which is clearer as a reference when choosing the risk percentage.
What is the probability of six losses in a row?
It depends on the win rate and the distance. At a win rate of 45 % over a hundred trades it is about 73 %, over two hundred about 93 %. That is, over a stretch of two hundred trades such a streak is almost inevitable.
What is the risk of ruin?
The chance of reaching a boundary outlined in advance — say, a hole of 50 %. In the calculator the boundary is set with a slider, and the share of runs that reached it is worked out by simulation.
Why does part of the runs still reach the boundary with positive expectancy?
Because expectancy is an average over many paths, while an individual path can start with a long chain of stops. That is exactly what a small share of risk insures against: with it such a path is survivable.
How do you use this calculation when choosing the risk?
Take the expected maximum of the streak, add two or three stops of buffer and check what drawdown such a streak gives. If the result goes beyond your drawdown limit, the risk percentage has to be reduced.
Why is the probability of a streak higher than it seems?
Because what is estimated is not «the chain starts now» but «it occurs at least once over the whole distance». Over two hundred trades there are almost two hundred such opportunities, so even an unlikely event becomes expected.
Does the calculation account for losses coming in clusters?
No, the model treats trades as independent. In reality market regimes change and losses cluster, so the calculated streak length is better treated as a lower estimate.
What does the stopping boundary set in this calculation?
The drawdown at which you stop trading by your own rules. The share of runs that reached it is the probability that the system stops before its edge shows.
Why is the risk of ruin not zero with positive expectancy?
Because expectancy is an average over many paths, while an individual one can start with a long losing streak. That is exactly what a small risk percentage protects against.
How does the result change at 2 % risk instead of 1 %?
The probability of the streak itself will not change — it depends only on the win rate and the distance. But the drawdown from it will double, and the share of runs that reach the boundary will grow.
Read next
